Growing Together
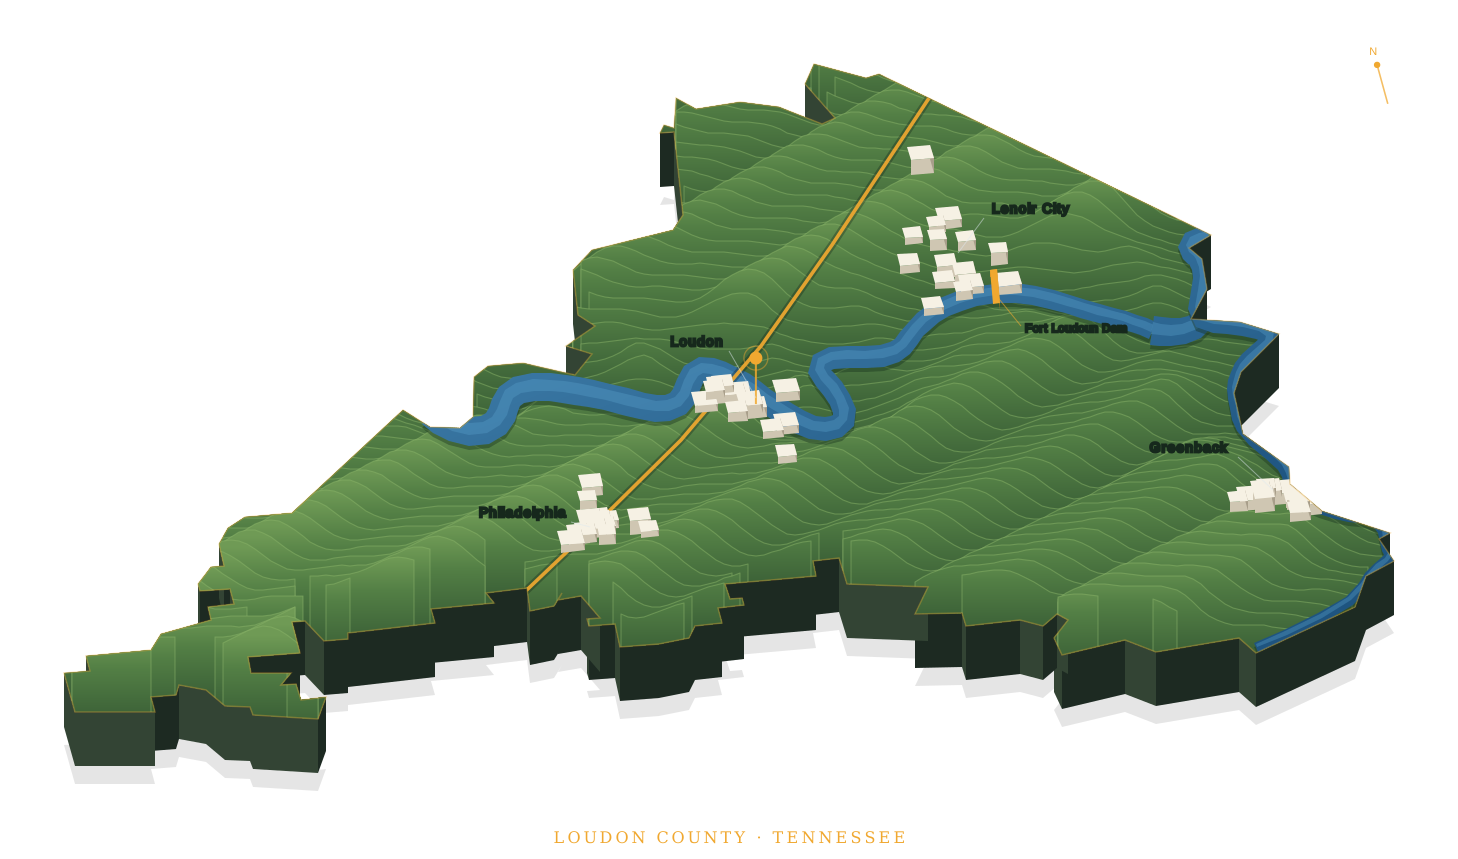
The County in Three Dimensions
A guided walkthrough · 3½ minutes
Fifteen chapters that build the county up in front of you — the ridges and the river first, then the growth boundaries, the rural areas, and what has actually been annexed since 2000. Play it at half speed or skip ahead. Click any ground to see where it stands.
City or County? Find Out Where You Stand
Interactive map · the whole county
Click your property. It tells you which growth-plan area you are in, whether a city may annex there, and what the property tax difference actually is — using the State Comptroller's certified rates. Streets, satellite, USGS aerial and topo basemaps included.
What the plan actually says
Extracted from the county's own adopted map
IN THE COUNTY
GROWTH BOUNDARY
KEPT RURAL
UNANNEXED
Since 2000 the cities have annexed 8.1 square miles, and 95.5% of it fell inside boundaries everyone had already agreed to — growth largely went where the plan said it would. And there are still 52 square miles inside those boundaries that have never been annexed. The room to grow is already there. The question is what it costs to serve it, and that is a conversation to have with the cities rather than at them.
Every figure comes out of the county's own adopted map and the State Comptroller's certified tax tables. The extraction is reproducible and the underlying data is published, so anyone can check the arithmetic — full transparency.
Download it: growth plan · annexations since 2000 · worklist (CSV) — GeoJSON in WGS84, opens in QGIS, ArcGIS or Google Earth.
Read the Framework For the County Commission → For Lenoir City →